Working with an E-commerce brand that has grown organically, since 2022 there has been significant growth. With the business being in much stronger position the CFO had signed of a budget pot for all things marketing data and Martech starting from the next financial year which equated to 10% of marketing budget. With the plan to increase marketing budgets and with the forecasted increase in revenues, the 10% for marketing data and Martech is likely to increase to around 15% to 20% in the following years.
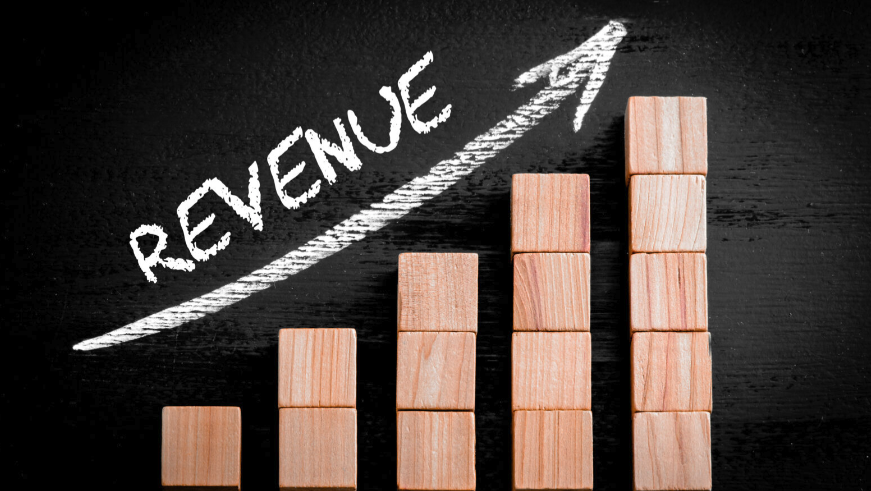
10% of marketing budget on marketing data and Martech equates to 4% of revenue seems on par with what (speculatively) the bigger brands spend on data and Martech which aligns with the likes of Uber, Spotify, Go Pro and Airbnb spending 5% to 6%.

(chart showing % of Marketing Data & Martech on Revenue)
To add context the E-commerce brand revenues are not to the scale of i.e., Uber etc. For the E-commerce brand, marketing budget is at 25% of revenue. The increase in marketing budgets has come from significant growth since 2022 mainly coming from an increase in pricing. From 2020 to 2022 it was a slower period which allowed the business to look at getting a better product market fit, range of products and improving quality which led to an increase in prices. With marketing budget staying the same upto end of current financial year starting in July there has been calendar year on year revenue growth.
To understand the caveats, that need to be factored in when investing 10% of marketing budget on data and tech:
- The financial year starts in July, the 10% will start from July 2025
- 10% excludes investment for additional resources
- If the 10% is not invested into data and Martech it will not be stripped out going into the next financial year
- Going into Q4 if the data and Martech budget is remaining from the 10% and it’s not required it will then be invested back into other areas of the marketing pot
- Aim to spend no more than 9% (90%) and keep a minimum of 1% (10%) as a buffer
- The target for year 1 is to spend closer to 7%, there is no hard and fast rule the full allocation is available if needed
Data and Tech Audit
The goal of the data & tech audit is to provide an unbiased view of where the business is today and align the insights into the business and marketing strategy. The data & tech audit understands the business through 2 core areas business and marketing which feeds into: KPI, Tech, Analytics and Measurement.
The goal of the audit was to understand where on the data and tech maturity curve the e-commerce brand sits, using the insights from the audit to help direct where the 10% investment can go into marketing data and Martech.
 Summary of Data and Tech Audit
The strongest area of the audit was KPI’s with measurement the weakest. Technology and Analytics had the most minimal viable solution in place. The biggest insight that came out of the audit was each of the 4 areas were too siloed, the value of data and tech comes from being aligned to business goals and objectives.
 KPI
KPI
The strongest area was KPI which is the most important of the 4 which will ultimately drive the success of marketing and the business. Where there was a clearly defined primary KPI which laddered up to the business KPI there was no marketing KPI framework in place to understand which other KPI’s support which has many domino implications from investment into channels and how those channels success is viewed.
Measurement
Measurement was the weakest, there has been no measurement undertaken of note. There has been testing done within channels without truly understanding the impact. The current ways of measurement are last click / data-driven from Google Analytics and ad platforms.
Technology
There was a minimal viable Martech set-up, but it was not future proof. There was confidence, trust and a solid set-up of tracking and measurement across digital platforms from Google Analytics and ad platforms. The main investment in recent years has gone into CRM + E-commerce platform with both being upgraded in the last couple of years. Future proofing the Martech stack it required a combination of server-side tracking; marketing data warehouse have become core pillars with a customer data platform. Depending on the maturity partnering with a data clean room could be viable but it does require the rest of the pillars in the Martech stack to be in place.
Analytics
For where the business is today the analytics is in a good position with some good fundamentals in place. All areas of the analytics will need to improve taking into context the growth rate in the next 3 to 5 years. For the ambitions in growing the brand, the analytics needs to evolve in line with measurement, KPI’s and technology. The maturity of the analytics driving better insights and measurement will come from data collection, data transformation, data storage, data visualisation and most importantly is consistency of data availability over a long period of time.
Investing into Data and Tech
The audit plus stakeholder interviews informed what the focus should be when it comes to developing and evolving the data and tech stack.
The options that were looked at:
Google 360
Investing into Google 360 stack had been explored previously (when GA3 was the main GA platform), without fully understanding if 360 can help and provide value. At the time when exploring Google 360 with GA3 the proposition from Google was very different to what it is with GA4, and the evolution of the business then v now has evolved.
To understand if Google 360 is the right investment it needs to be evaluated from a cost perspective and does it help deliver against the insights uncovered from the audit aligning to the business and marketing requirements.
Being able to understand the ROI for Google (GA4) 360 would make or break if it’s a viable solution would be assessed using the ROI calculator.
The costings for Google 360 are based on a usage model:
- The key areas of consideration for Google 360. Additional costs will come from:
- More than 25m events per month
- Creating sub properties or rollup properties
- Sending events i.e., into sub properties
- Data sampling thresholds: GA4 360 provides 1 billion events v GA4 free 10 million events
- Data retention: GA4 360 provides 50 months v GA4 free 14 months
- GA4 360 provides 400 audiences v GA4 free it’s 100 audiences
To understand the ROI for Google 360 one of the biggest variables that is not factored is the time investment the cost of implementing and management of Google 360 which takes into consideration the annual growth rate of the business and % annual uplift with of Google 360 mapped over a 5-year period to help provide a view of the ROI. This will help directionally to understand what the return on the investment will be.
The brands digital agency (a Google re-seller) provided the annual cost for Google 360 (which we believe includes their management fees, but it was not confirmed ideally wanted the cost of just Google 360 to provide a better understanding of the ROI). The additional costs were provided by the CMO and CFO and this was critical to ensure there was alignment but also understanding of how the ROI is being calculated.
Looking at a 5 years payback, it would have taken 17 months to payback the investment for Google 360.

(5 year payback calculation based on Net Revenue)
Signing up to Google 360 which is built around GA4, the key selling points of Google 360 provides not having to worry about data processing, sampling with increased limits on events, custom dimensions etc.
| Feature | GA4 Free | GA4 360 |
| Event Parameters | 25 | 100 |
| Custom Dimensions | 75 | 225 |
| Custom Metrics | 50 | 125 |
| Conversions | 30 | 50 |
For where the business is today in terms of size, the volumes of traffic its driving paying for Google 360 would have been a sizeable chunk of the budget would not have been the best business decision. Where previously with Google 360 + GA3 it provided a connection to Big Query now it’s available with GA4 free as are the integrations with all Google products.
For where the business is today and its requirements coming out the audit, the value of Google 360 is not as clear with a 17 month payback. As the business matures and potentially grows into new markets the value of creating sub properties + increased volume of traffic Google 360 would likely to be more appealing in the future.
Developing the data and tech requirements
Developing the e-commerce brand data and tech required an agnostic approach than relying on one tech stack to deliver against the business goals.
The areas of investment:
Server Side Tracking
When auditing the set-up and data one of the key insights Google Analytics was tracking 75% of all transactions + revenue with high % of revenue coming in via direct. With the depreciation of cookies, privacy, regulation etc a 25% loss of data reported in Google Analytics is significant to gain trust in the data. The bigger impact is the loss of data going into the ad platforms Google Ads, Facebook etc that has implications with bidding, audience segments, higher media costs, higher CPA’s and a declining attributed revenue share to the platforms.
How does server side tracking work, the website will send data first to the cloud server which then distributes data between third-party vendors and tracking platforms. The cloud server is used as a proxy from sending information from the site to a vendor i.e., Meta.
 The main benefits of server side tracking that will help the e-commerce business with the challenges they are facing:
- Accurate data collection and conversion tracking – The improvement of data collection will come from reducing the impact of ad-blockers and IOS restrictions
- Minimising the impact of ad blockers – With server side requests are sent from the primary domain using a sub domain meaning adblockers can’t detect it
- Governance and control – Server side allows full data control meaning each vendor will only receive the data configured in the tag manager
- First party cookies + extended cookie lifetime – With the use of a custom – subdomain it will help set-up first party cookies it will help with extending the cookie lifetime
- Improved page load times – Reducing the number of JavaScript’s will help with page load times
Marketing Data Warehouse
The current workflows and process on average 70% of time is invested into data collection to building dashboards which is done manually. With sufficient time not dedicated to generating insights and activating against them. There was also an over reliance on trusting platform data i.e., Facebook, Google Ads, Google Analytics etc which created data discrepancies with the finance teams in what was the true performance. With the goal of accurate, actionable data.
This is where a marketing data warehouse can provide a solid and consistent data foundation for better measurement. The marketing data warehouse becomes invaluable by mapping the data requirements which will align with the maturity and the business questions being asked.
Before commencing with the marketing data warehouse to better understand the data requirements developing a KPI framework that talks the language of business and marketing is more likely to get approval from key stakeholders.
The KPI framework creates a domino impact which is pivotal to driving success:
- Management and reporting of the KPIs in the marketing data warehouse
- Developing the measurement strategy
When it comes to selecting KPI’s it needs the right balance which is split into 4 different buckets that covers the full spectrum from business to marketing and planning.
- Business – KPIs that are important to the board
- Brand + Direct Response – KPIs that are important to the marketing team
- Campaign – KPIs that help the marketing team with planning
Developing the KPI framework is the first step then it requires mapping out:
- Leading and Lagging indicators
- Metric Tree
Mapping out the KPI framework provides info to what data is needed, the structure of the data to provide the right level of insights so it can be collected and stored in the marketing data warehouse.
There were in total 10 core data sources including google docs that will provide the required data to deliver against the KPI framework. Big Query is the likely marketing data warehouse, Funnel was the recommended solution to extract and load the data, SuperMetrics is another option. It made sense for data visualization to utilise Looker Studio, which is free, it could be the long term solution something to consider at a later stage which is the right partner.

Measurement
The evolution of the measurement away from last click will be a combination of Econometrics, Incrementality and Brand Tracking. All 3 techniques move away from a short term view and answer different business question, with Incrementality and Brand Tracking they can be validated within Econometrics.
 Econometrics
For where the E-commerce brand is today and with its growth plans, Econometrics will provide the strategic view to understand what has happened to help plan for the year ahead against the business goals and targets that need to be delivered against.
The current methodology using a mix of last click and attribution models within platforms the data concerns from privacy to ad-blockers etc the value and trust of the data from platforms will diminish. Which is one of the benefits of Econometrics it uses aggregated level data that can be trusted that is not coming from the platforms.
Shifting from pure performance to balancing the long and short Econometrics can provide the insights to help with the next stage of growth which includes investing into brand campaigns:
- Baseline (Organic) revenue
- Forecasting
- Budget allocation
- ROI for each channel
- Non media impact in driving revenue i.e., seasonality, competition, economic climate
- Which channels drive different outcomes i.e., revenue and brand awareness
- Synergies between different channels
- Diminishing Returns
- Adstock Levels
Looking at revenue performance at a macro level from 2019 to 2024 there has been plenty of variations in the data which Econometrics can dissect to better understand it’s impact. The challenge with Econometrics is how much historical data is available; in this case there’s a minimum of 6 years of available data. Looking at the data anything pre July 2022 there is a lot of noise in the data which will make it harder to model and won’t provide as much valuable insights. It makes sense to start the Econometrics from July 2022 start of the financial year. There will likely be 3.5 years of available data which is 182 weeks of data. With a new product range and pricing + new strategy in play it validates to build the model from July 2022 onwards.

(Monthly revenue from January 2019 to December 2024)
- 2022 (calendar year) revenue surpassed 2019 by 5% (Back to pre-2020 revenue levels)
- 2020 and 2021 generated in total 70% of the revenue v 2019
- 6 months of no budget
- 6 months of 20% budget running
- Email had the highest revenue share in 2020 and 2021
- 2024 was the highest revenue year for the E-commerce brand, 13% more than 2023 and 44% more than 2019
- 90% of budget has been going into Meta, TikTok and Google
- March 2023 onwards TikTok had the highest budget share taking over from Instagram
- March 2022 a new range of product range launched + increases in prices on average 30%
- Old product range sold out
Share of search (SOS) data had been used sporadically but it was never the focus for the different stages of the business, it did not provide any real insights. With the growth plans it has now become a critical KPI.
Using share of search data to understand insights around competing brands. SOS data can also be used within the Econometrics to understand historically but also look forward and forecast against business goals.
Looking at 2 of the main competitors:
- The biggest competitor in revenue & market share
- The closest competitor where the e-commerce brand sees as a realistic target to overtake in revenue and market share

(Share of Search % Yearly changes)
- The E-commerce brand
- 5% down on branded searches in 2024 v 2019
- Grown branded searches by 89% v 2022
- Closest competitor
- Grown branded searches by 141% in 2024 v 2019
- Grown branded searches by 137% v 2022
- Biggest competitor
- 10% down on branded searches in 2024 v 2019
- 28% down on branded searches in 2024 v 2022
At the end of year 1 the goal will be to run 1 round of Econometrics which will be done in advance
Incrementally
Incrementally will become a key measurement component with the e-commerce brand likely to go through many different phases during their growth with changes in budget and media mix this is where the value of incrementally can help better deliver the business goals. With a high % of budget going into ad platforms taking platform reporting and insights at face value is risky and likely to lose revenue. Which is where incrementally can demonstrate which media investments are contributing to business growth by reducing wastage, finding opportunities to scale and reallocate media spend.
Developing a testing plan for the year ahead becomes critical to schedule the tests that align with the wider marketing plan, how budgets are being spent and any promos that may be taking place. The annual plan will help prioritise the most impactful tests at the right times and that no tests are overlapping.
With Econometrics likely to be part of the plan at least once a year. The incrementally tests can inform the Econometrics by removing any uncertainty and improving the accuracy when it delivers the outputs.
Brand Health Tracking
Is brand health tracking justified? With the current positioning of the brand the answer is no. With the growth plans brand tracking is justified. Looking at some of the areas where brand tracking can help:
- Significant investment into brand campaigns
- Crowded category with many competitors understanding how the e-commerce brand stands out against competition on key metrics
- Justify the brand investment into the board
- Measuring the impact of multiple products and regions (potentially at a later stage)
With all the changes that have taken place over the last few years mainly better product market-fit it does feel the investment into brand tracking is the right time. With no real investment into the brand so far, being able to capture the baseline data before the investment into brand campaigns will provide the insights to understand the impact.
NPS has been the closest metric to measure ‘brand’, share of search has become a key brand metric. Looking to grow the brand beyond the 5% who know the brand which is where brand tracking provides the insights on what different segments think of the brand. With the e-commerce brand likely to go through many different phases during their growth with changes in budget and media mix understanding how key brand metrics changes over time will become critical.
Brand health tracking has multiple uses cases which is backed up by quantitative and qualitative research a totally different dataset then what is currently available to the business. Brand health tracking allows to:
- Measure brand and campaign performance
- Test out hypotheses
- Track competitors performance
These use cases have not been part of the thinking process in the current iteration of the brand until now where it becomes a core part of insights.
There are many metrics that will be available to dissect to understand brand performance. 3 of the key brand health tracking metrics the e-commerce brand will want to track:
- Top of mind awareness
- Spontaneous awareness
- Prompted awareness
The brand health tracking metrics can also be used strategically to be able to hit business targets where the question may be to grow i.e., prompted awareness by x% in the next 2 years then the marketing and media plan etc is built around that goal which will be supported by the Econometrics.
How to invest 10% into Marketing data and tech
There was a clear understanding of the areas of marketing data and tech that needed investment. Then it became about how to invest the 10%, it was a max of 9% in year 1. All the areas where there needed to be investment it would be working with partners and where possible it may transition in-house at some point.
Getting estimate costings from potential partners out of the 10% investment in year 1 there would be 1.5% remaining as a buffer.
 The only caveat is brand tracking is more likely to start H2 of the financial year if not later depending on when the brand campaign launches. The aim should be to get a baseline of minimum 3 months of tracking, if not 6 months. Out of the 15% that will be invested into brand tracking likely won’t be more than 10% in year 1.
One area of investment that was not part of the costings was a partner to help with incrementally testing, more likely to be in the plan for year 2. It’s not an immediate priority will work in combo with the paid media agency to design, execute and measure the impact of the tests.
Roadmap
The roadmap is dictated by next year’s marketing plan and the investment into brand will likely start in April considering peak period is Q4 (calendar year).
 Server Side tracking will start in June, one month early. Server side is a quick win and with a nominal fee it makes sense to start with more robust tracking sooner than later
- Marketing Data Warehouse is critical to the wider strategy, it will be an on-going process. It will provide a lot of the data for Econometrics
- With the brand campaign likely to start in April the Econometrics will need to be delivered ideally by November / December so marketing planning for H2 can factor the insights
- Brand health tracking will start in January to get a minimum of 3 months of baseline data before the brand campaign launches