For over 25 years, I have been a regular at a family-owned pizza restaurant. Driven by the love of pizza and a passion for data, I have supported the business with ad-hoc data support in exchange for the occasional free dinner.
Back in 2017, the pizza restaurant sought a better way to track every order. Without investing into an EPOS system, my recommendation was Google Sheets (Excel), building a manual tracker that became the backbone of the business data intelligence. The main file logs every order since mid-2018, capturing key details such as:
Order tracker:
- Order No
- Order Date
- Order Value
- Order Type
- Food cost
- Packaging cost
- Platform cost
- Payment type
- Payment type cost
- Total cost
- Profit per order
Order item tracker:
- Order No
- Order Value
- Order Type
- Items Ordered
- Item Category
- Qty of Items Ordered
- Item cost
- Selling price
- Margin per item
- Profit per item
- Total profit per item
Business KPI tracker: (to keep all data in one place a KPI’s tracker was added)
- Date
- No of Orders
- Dine-In Order
- Takeaway-Direct Orders
- Delivery-Platform Orders
- Revenue
- Food Cost
- Total Cost
- Gross Margin
- Gross Margin %
- Net Margin
- Net Margin %
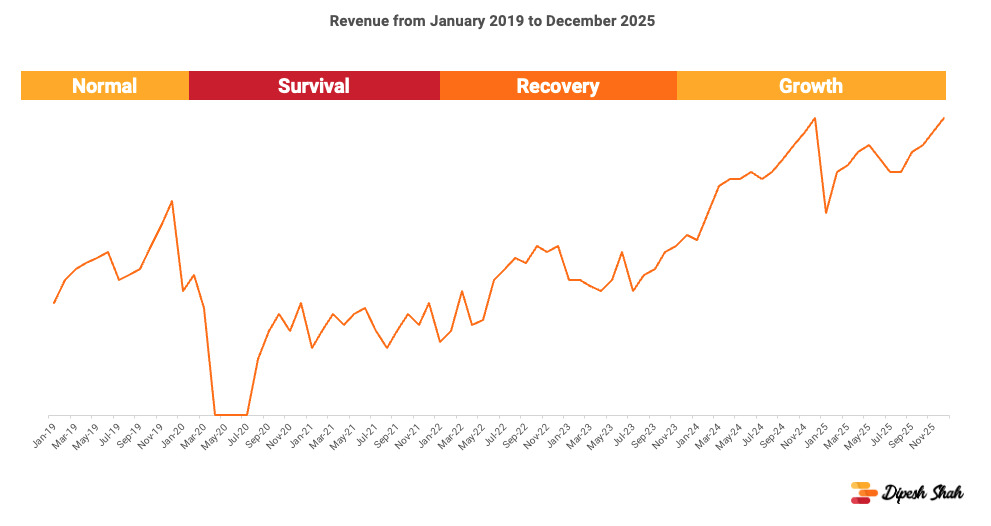
From the available data I created a monthly master view from January 2019 to December 2025 encompassing 29 metrics with 17 calculated fields.
Summary
Between 2019 and 2025, pizza restaurant experienced dramatic swings in performance and strategy. The pizza business moved from a stable, dine-in model (2019), through pandemic-driven to survival (2020 to 2021) + recovery phases (2022 to 2023) dominated by takeaway and delivery, to growth phase (2024 to 2025) driven by pricing and the effectiveness of paid media.
Business Phases
There were four clear distinct phases from 2019 to 2025:
- Normal (2019) – Stable operations with a strong dine-in focus
- Survival (2020 to 2021) – Navigating pandemic disruptions and business shifting to takeaway and delivery
- Recovery (2022 to 2023) – Return to normal pre 2020 norms, but still below benchmarks
- Growth (2024 to 2025) – Strategic changes including pricing and paid media drove improvements in revenue and margins
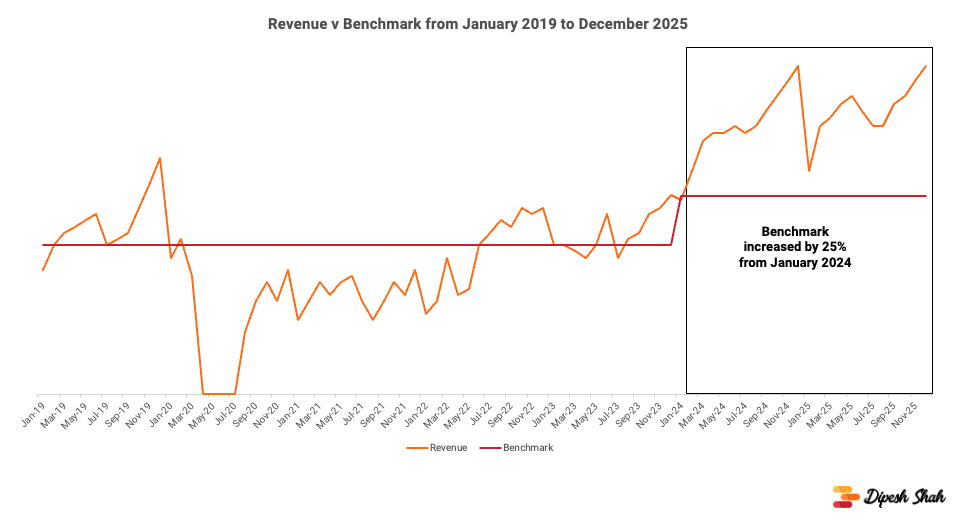
 Business Performance & Benchmark
The business had a monthly benchmark set to cover all costs + deliver a profit. For 48 consecutive months (March 2020 to November 2023) actual revenue fell short of its target. In January 2024 the benchmark increased by 25% reflecting increased cost pressures.
 Channel Mix Evolution
The channel mix underwent significant changes from 2019 to 2025. The shift was driven by consumer behaviour and business decisions.
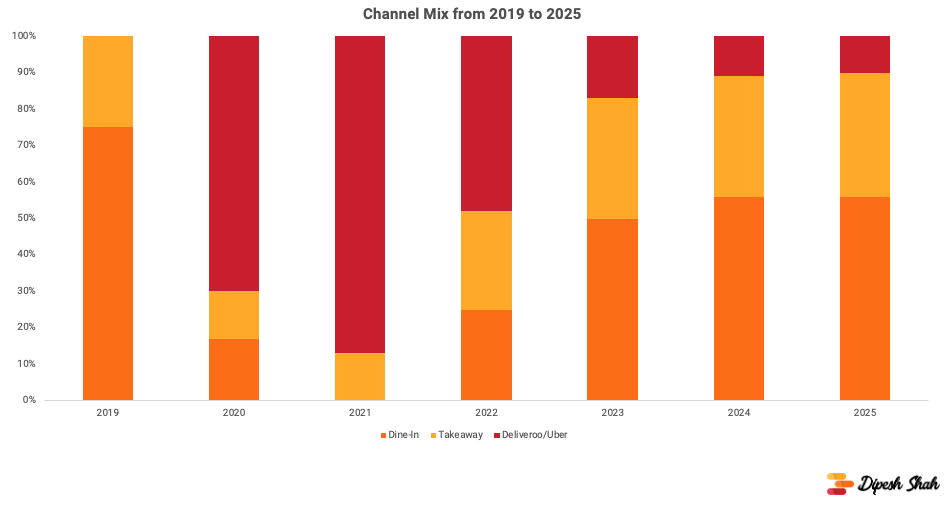 Normal (2019) – Dine-in dominated
- Survival (2020 to 2021) – Takeaway and delivery became the sole revenue stream
- Recovery (2022 to 2023) – Takeaway and delivery became a core revenue stream but dine-in was slowly recovering
- Growth (2024 to 2025) – Dine-in recovered to take 55% share of revenue, Takeaway (direct) 35% and Deliveroo/Uber share fell to 10%
Margin Analysis
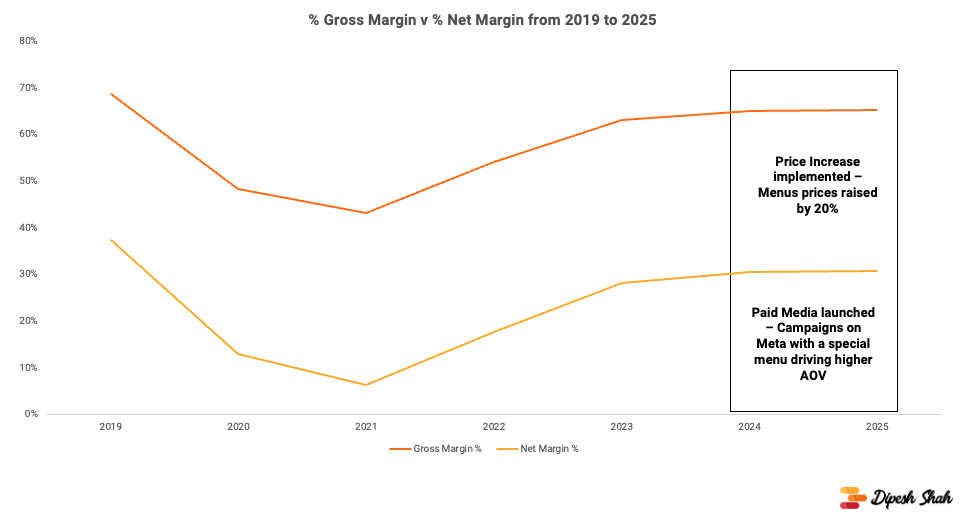
Between 2020 and 2022 the dominance of takeaway + Deliveroo/Uber during the pandemic eroded overall profitability. To address this, the business increased prices and streamlined the menu for Deliveroo/Uber from January 2024 and launched paid media campaigns on Meta resulting in higher AOV and improved margins.
- Dine-in: Highest average order value (AOV), gross margin (65–70%), and net margin (40–45%)
- Takeaway (direct): Moderate gross margin (60–65%) and net margin (10–15%)
- Deliveroo/Uber: Lowest margins, with gross at 30–40% and net ranging from 5% to –5%
Between 2020 and 2022, the dominance of takeaway and Deliveroo/Uber during the pandemic eroded overall profitability. External costs to drive orders primarily Deliveroo/Uber commissions (paid media spend from Jan 2024) average 30% of revenue for 21 months (August 2020 to April 2022), severely impacting net margins. During this period, it highlighted the challenges of maintaining profitability especially when external costs consumed over 30% of revenue, for every £3 of revenue earned, £1 went to Deliveroo/Uber.
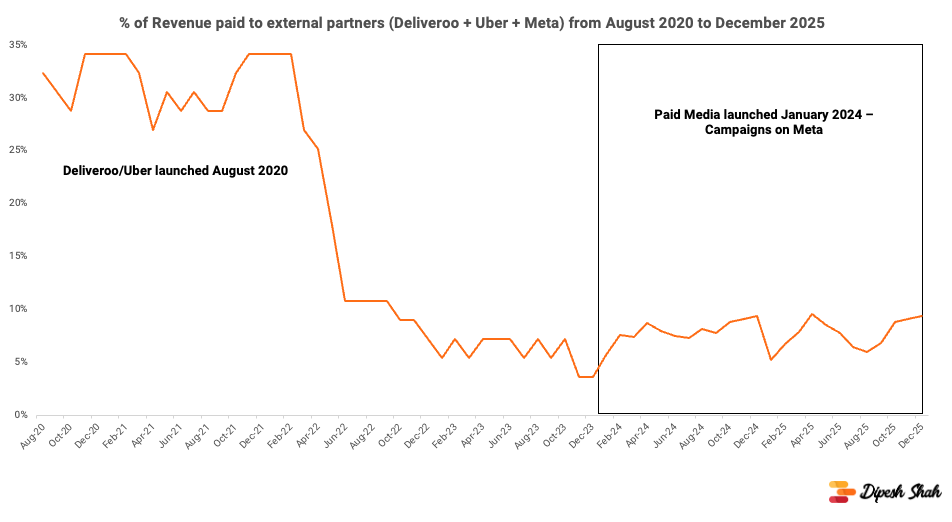 To combat this, the business implemented three key strategic changes from January 2024:
- Price Increase: Menu prices were raised by 20%, resulting in a higher and stable average order value (AOV)
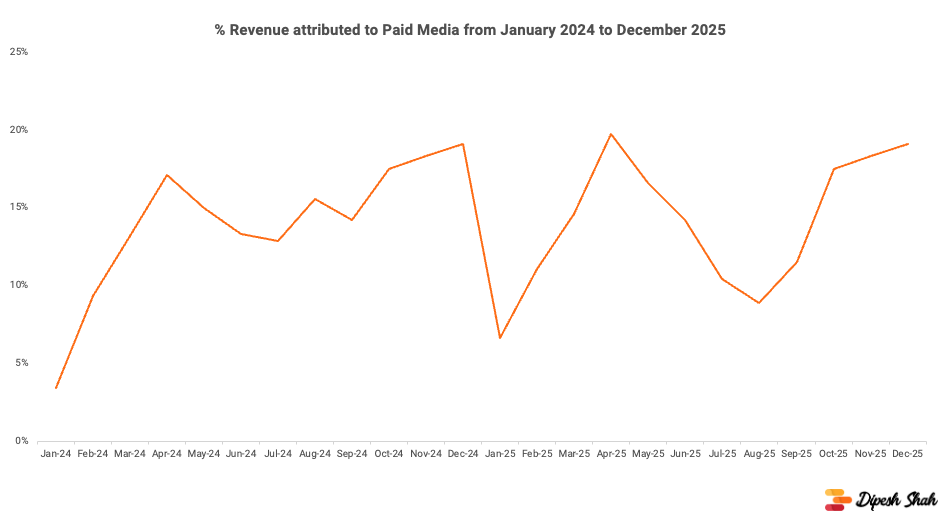
- Paid Media: Campaigns on Meta driving higher-value orders
- Menu Streamlining for Deliveroo/Uber: The menu was optimised to focus on higher-margin items
These actions led to a reduction in external partner costs, which averaged at 7% to 8% of revenue in 2024–2025. A level that was far easier to stomach.
Channel Margin Comparison:
- Dine-in: Highest AOV, gross margin (65–70%), and net margin (40–45%).
- Takeaway (direct): Moderate gross margin (60–65%) and net margin (10–15%).
- Deliveroo/Uber: Lowest margins, with gross at 30–40% and net ranging from 5% to –5%.
Strategic Actions
To counter the challenges with the impact on net margins three key actions were taken in 2024:
- Price Increase: Menu prices rose by 20%, to offset cost pressures and improve margins
- Paid Media: Targeted campaigns on Meta introducing a special menu, attracting new customers and driving higher average value orders (AOV)
- Menu Streamlining for Deliveroo/Uber: The menu was was refined to focus on higher-margin items
Paid media contributed to an average of 15% of monthly revenue helping revenue grow by 79% in 2024 and 93% in 2025 compared to 2023. 27% in 2024 and 36% in 2025 growth in revenue compared to 2019.
 Incremental revenue growth, excluding price effects, was 37.6% in 2024 and 47.4% in 2025.
Net Margin
Net margin is the most reliable indicator of business health:
- 2019: Most efficient year for net margin at 37%
- 2020–2022: Net margins were squeezed, ranging from 6% to 18%.
- 2025: Highest net profit achieved, driven by a balanced channel mix and effective paid media marketing
 With strong revenue growth, net margin improvement in 2024 and 2025 versus 2019 was only 3%.
What has helped sustaining higher net margins:
- A family-owned business, family only took profit before wages
- Rent is 5% to 7% of revenue. Average 3% to 5% cheaper than most pizza restaurants
This helped improve net margin by 10%.